The stable decrease in industrial production continues
During August, the situation in manufacturing did not change significantly — the production fell 29% compared to the same month of the previous year. The main reason causing the decline was insufficient demand both in domestic and external markets.
The production decreased in all branches of manufacturing except the manufacture of beverages and the manufacture of pharmaceutical products. The decrease in the manufacturing of food products (3%) was the smallest. The decline in the production of food was retarded by the decrease of producer prices. Since the beginning of the year, the producer prices of milk, flour and oil have decreased significantly. The growth in production of distilled spirits and beer compared to the same month of the previous year was caused by low comparison basis due to the growth of excise tax in July 2008. Compared to August of the previous year, the manufacture of electronic products, motor vehicles and machinery and equipment fell more than 40%. The manufacture of metal and chemical products and building materials decreased more than 30%.
In August compared to August of the previous year, the production of electricity decreased 39%, the production of heat decreased 17%. The decrease in electricity production was caused by partly replacement of own production with imports from Lithuania.
In August compared to July, industrial production total as well as manufacturing fell 1% according to the seasonally adjusted data. From January to April, the decrease in industrial production remained within 4% compared to the previous month, in May the production increased 2%, in June decreased 1%, in July increased 2% again.
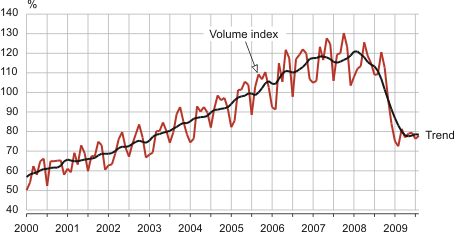
The volume index and trend of production in manufacturing, January 2000 – August 2009
(2005 = 100)
| Economic activity | Change compared to previous month according to seasonally adjusted dataa | Change compared to corresponding month of previous year | |
|---|---|---|---|
| according to unadjusted data | according to working-day adjusted datab | ||
| TOTAL | -1.1 | -27.9 | -27.9 |
| Energy production | -9.2 | -35.2 | -35.2 |
| Mining | 15.7 | -2.8 | -2.8 |
| Manufacturing | -1.2 | -28.8 | -28.8 |
| manufacture of food products | 3.4 | -2.7 | -2.6 |
| manufacture of beverages | 0.7 | 9.6 | 9.6 |
| manufacture of wood and wood products | -0.9 | -29.3 | -29.3 |
| manufacture of fabricated metal products | 2.0 | -39.0 | -39.0 |
| manufacture of computer, electronic and optical products | 2.9 | -44.9 | -43.2 |
| manufacture of electrical equipment | -3.9 | -25.4 | -25.4 |
| manufacture of chemicals and chemical products | 4.5 | -35.5 | -35.5 |
| manufacture of furniture | -10.0 | -29.4 | -29.4 |
| repair and installation of machinery and equipment | 13.4 | -20.9 | -20.9 |
| manufacture of building materials | 4.7 | -39.3 | -39.3 |
a In case of the seasonally adjusted volume index, the impact of the differing numbers of working days in a month and seasonally recurring factors has been eliminated. It is calculated only in comparison with the previous month.
b In case of the working-day adjusted volume index, the impact of the differing number of working days in a month has been eliminated. It is calculated only in comparison with the corresponding month of the previous year.