There is an almost sevenfold difference between the at-risk-of-poverty rates of local governments in Estonia
The share of local governments with a low poverty rate was smaller in Harju, Lääne and Saare counties, where at least half of the local governments had an at-risk-of-poverty rate below the Estonian average (17.6%). In Hiiu, Ida-Viru, Valga and Võru counties, all local government units had a poverty rate higher than the Estonian average, ranging from 18% to 33%. The biggest differences were recorded in Harju and Tartu counties, where some local governments have a very low and some a very high at-risk-of-poverty rate. Poverty rates varied the least in Järva and Lääne counties, where the difference between the highest and the lowest rate was less than five percentage points.
In Tallinn city, at-risk-of-poverty rate was the highest in the city districts of Lasnamäe and Põhja-Tallinn (16.1% and 16.9%, respectively) and the lowest in the Pirita city district (6.9%). The other districts of the capital had a poverty rate of 10–14%.
At-risk-of-poverty rate in local governments, 2011
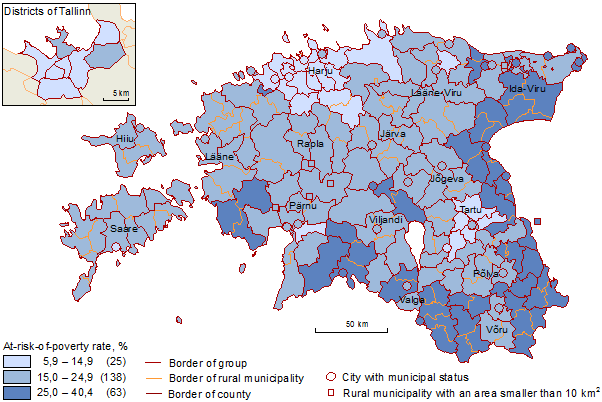
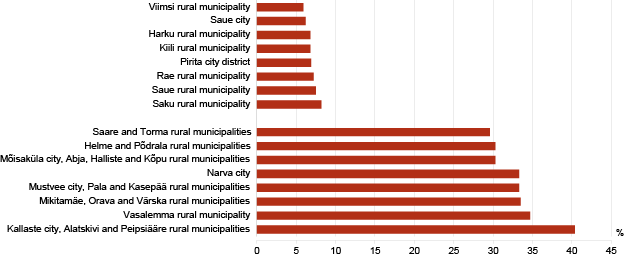
The ten areas with the lowest poverty rate are all located in Harju county (at-risk-of-poverty rate below 9.5%), but Harju county also includes Vasalemma rural municipality where the poverty rate (34.7%) is one of the highest in Estonia. The remaining local governments with a very high poverty rate are located in areas by the border in Eastern and Southern Estonia (at-risk-of-poverty rate over 30%).
Local governments with the lowest and the highest at-risk-of-poverty rate, 2011
The World Bank has developed a methodology for small area estimation. It has also created special software for estimation of poverty indicators, by combining data from social surveys and the population and housing census. As a result of the World Bank’s project for 2012–2013, poverty will be mapped in all European Union Member States using the same methodology.
Statistics Estonia participated in the World Bank’s project and mapped the at-risk-of-poverty rate in groups of local government units, based on the data of 2011 Population and Housing Census and the Estonian Social Survey 2012 (reference year 2011). At-risk-of-poverty rate is the share of persons whose equalised yearly disposable income is below the at-risk-of-poverty threshold. The at-risk-of-poverty threshold is 60% of the median equalised yearly disposable income of household members. Equalised disposable income is the total household income divided by the sum of equivalence scales of the household members.Statistics Estonia’s goal was to map poverty on a regional level that is as detailed as possible. However, some local government units are too small for the methodology used in this project, which would cause great variability in the poverty estimates. We decided to map poverty by groups of local government units. The existing local government units were divided into 124 areas (each containing 1–6 local government units), and Tallinn city was mapped as 8 separate districts. With the help of the model, we predicted the at-risk-of-poverty rate for 132 small areas and also for higher levels of the hierarchy (counties, the whole country).
More information about the project and a detailed description of the methodology can be found in Statistics Estonia’s publication ”Eesti piirkondlik areng. 2013. Regional Development in Estonia”, published at the end of November. More detailed data have been published in the Statistical Database.