The backwash of the economic crisis decreased the innovativeness of enterprises
An enterprise was considered innovative in the Survey if in the last three years it had put into practise an organisational or marketing innovation, introduced to the market a new or significantly improved product, implemented a new or significantly improved process, or had expenditure on activities specifically undertaken to develop and/or implement a product or process innovation.
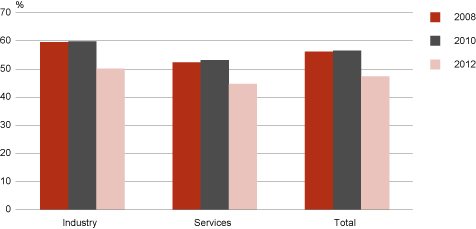
The share of innovative enterprises, 2008–2012
The decrease in innovativeness varied slightly by type of innovation. While the share of enterprises with organisation or marketing innovations declined in 2012 compared to 2010 by 2.0 and 3.7 percentage points, respectively, the share of those having introduced a product innovation decreased by 4.8 and the share of those having implemented a process innovation by 7.4 percentage points. In other words, while in 2010 every fourth enterprise was product-innovative, then in 2012 – only every fifth.
Innovativeness was in decline practically for all economic activities. Among major ones, for example, in the textile industry, it fell from 70% to 35%, and in the timber industry from 64% to 41%. At the same time, the innovativeness of the food industry remained at the level of 64%, and for enterprises engaged in water collection, treatment and supply, innovativeness even rose from 45% to 66%.
The supplemental module of the Survey dealt with the enterprises’ strategy. Certain differences between innovative and non-innovative enterprises became evident. Innovative enterprises declared the increase of profit margins to be their most important strategic goal, while non-innovative enterprises were focusing on turnover increase. Increasing flexibility and responsiveness was considered the most valuable mean to reach the goals by innovative enterprises, reducing in-house costs of operation by non-innovative enterprises. However, there was an agreement about the most important factor that obstructs meeting an enterprise’s goal – both groups considered strong price competition to be that factor.
The data from other countries will be published in Eurostat’s database only in the autumn of 2014, but it is already possible to compare our results to the Finnish ones. That kind of a decline in innovativeness was not observed in Finland and it remained at the level of 53% both in 2010 and in 2012. It means that while in 2010 our enterprises outpaced the Finnish ones in terms of innovativeness, then in 2012 we were already lagging behind.
The innovation survey is conducted biannually across Europe, and in 2012 the frame of the survey consisted of 1,779 industrial and 1,706 service enterprises with at least 10 employees. Compared to earlier surveys, the coverage of service industries was extended to the economic activities with EMTAK codes 59 (motion picture, video and television programme production, sound recording and music publishing activities), 60 (programming and broadcasting activities), 72 (scientific research and development), and 73 (advertising and market research). Enterprises operating in the listed activities made up only 3% of the survey frame, so comparability is not danger major issue. Especially because, among the listed economic activities, only scientific research and development had an exceptionally high rate of innovativeness, reaching 94%.