The Estonian economy grew 1.1% in 2015
2015
In 2015, the GDP at current prices was 20.5 billion euros.
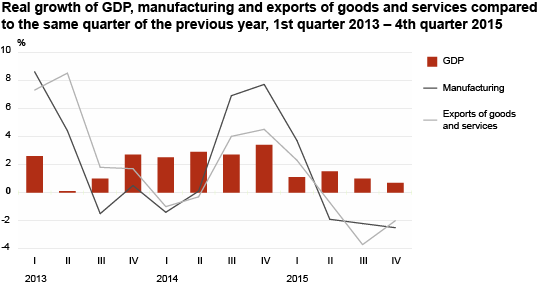
The year was characterised by a slow but steady growth of the Estonian economy. In the 1st quarter the GDP grew 1.1% compared to the 1st quarter of 2014, while in the 4th quarter the year-over-year growth was 0.7%. In total, the Estonian GDP increased 1.1% in 2015.
In 2015, the decrease in value added in transportation and storage influenced the Estonian economy the most. The decline in construction and manufacturing activities had a big negative effect on the GDP as well. The construction volumes on the domestic construction market decreased and the value added of construction decreased mainly due to a decrease in the construction of structures and repair and reconstruction work in building construction. The biggest Estonian activity, manufacturing, decreased mainly due to a weak external demand.
Agriculture, forestry and fishing contributed to the increase of the GDP. In addition, professional, scientific and technical activities and trade contributed the most to GDP growth in 2015. Trade increased mainly due to a stable growth in retail sales.
Despite the increase in the first quarter of the year, in 2015, the real export of goods and services fell 1.1% compared to 2014. The import of goods and services decreased 1.8% . The decreased export and import of electronic products had the biggest negative impact on Estonian foreign trade.
Similarly to the external demand, domestic demand was weak. Domestic demand fell 0.7%, mainly as inventories decreased. Compared to 2014, inventories decreased in all subdivisions. However, household and general government final consumption expenditures increased. The increase in household final consumption expenditures was mostly caused by an increase in the expenditures on food, recreation and transport.
Real gross fixed capital formation fell 4.5%. The investments of non-financial enterprises sector in equipment and machinery and transport decreased the most. At the same time general government investments increased. Although domestic demand decreased, the GDP increased and the total final consumption expenditures, gross fixed capital formation and changes in inventories total was smaller than the GDP by output method, forming 96.6% of the GDP.
Net export, i.e. the difference between export and import, was positive in 2015. The share of net export in the GDP was 4%, which was higher than in the four previous years.
In 2015, the GDP grew slower than the number of hours worked and persons employed (which grew 2.3% and 2.8%, respectively). Therefore, labour productivity per employee and hour worked decreased by 1.6% and 1.1%, respectively. At the same time, the labour costs related to GDP production have increased. Unit labour cost grew 5.7% compared to 2014.
4th quarter of 2015
The GDP at current prices was 5.4 billion euros in the 4th quarter of 2015.
In the 4th quarter of 2015, the Estonian economy grew 0.7% compared to the 4th quarter of 2014. In 4th quarter, the seasonally and working-day adjusted GDP increased by 0.9% compared to the 3rd quarter of 2015 and by 0.8% compared to the 4th quarter of 2014.
The GDP in the last quarter of 2015 was driven the most by a rise in agriculture, forestry and fishing. Furthermore, the value added in information and communication and professional, scientific and technical activities also provided important support for economic growth.
In real terms in the 4th quarter of 2015, construction slowed the Estonian economy down the most. In addition, the decline in the value added of manufacturing and transportation and storage had a considerable negative effect on the GDP in the 4th quarter.
In the 4th quarter the GDP grew slower than the number of persons employed, but faster than the number of hours worked. Therefore, compared to the same quarter of the previous year, labour productivity per employee decreased, but labour productivity per hour worked increased. Unit labour cost increased 5.2% in the 4th quarter of 2015.
In the 4th quarter of 2015 the domestic demand remained on the same level as in the previous year. Domestic demand grew 0.2% in real terms, mainly due to an increase in household and general government final consumption expenditures and decrease of inventories. Household final consumption expenditures increased 3.2% at real prices. In the 4th quarter, the decrease in gross fixed capital formation slowed down, being 0.4% smaller at real prices. The growth of investments was mainly influenced by the growth of investments in machinery and equipment by the general government.
In the last quarter of 2015, the real export of goods and services decreased 2.0% compared to the same quarter of the previous year and the real import of goods and services fell 0.7%. Trade was influenced the most by a decrease in the export and import of electronic equipment. The share of net export in the GDP was 2.9%.