Statistics Estonia develops a useful tool for governance decisions
Mart Mägi, Director General of Statistics Estonia, told that the idea for the dashboards grew out of enquiries from state authorities, enterprises and professional associations who were lacking a good overview of indicators in their field. “We gave them dashboards so that they can get an overview of the most important indicators. Statistics Estonia collects and analyses a large amount of data every day, and dashboards are one way of giving something back to the data providers. Dashboards allow monitoring the developments in different fields and making informed decisions based on this information,” explained Mägi.
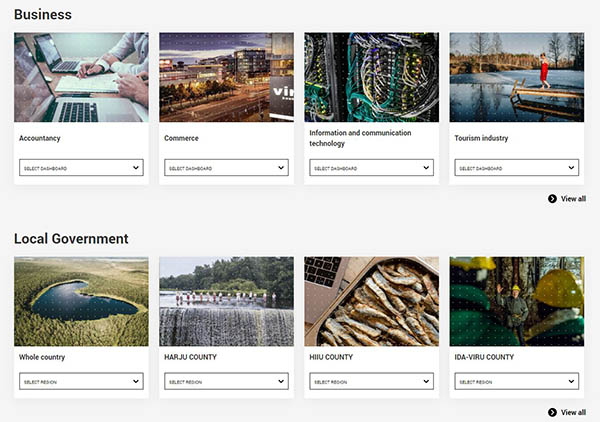
The governance dashboards cover business data, regional statistics and indicators of development plans. The data are displayed as graphs and charts. It is possible to customise the dashboards to create overviews of indicators of interest, to download and share information in various formats. The data used are from the statistical database of Statistics Estonia and are updated automatically.
The first to receive dashboards were the Ministry of Social Affairs and professional associations in the tourism sector. Hede Sinisaar, Head of the Department of Statistics and Analysis at the Ministry of Social Affairs, stressed their importance: “Dashboards provide a quick overview of the goals of the ministry’s development plan. The data are updated automatically, which means that the most recent data can be accessed more conveniently than before.”
Maarika Liivamägi, Managing Director of Estonian Hotel and Restaurant Association, emphasised the practicality of the dashboard as a single data source. “The dashboard is updated with the most recent data and additional information can be added if the need arises. This is a good example of cross-sectoral cooperation, contributing to a common understanding of the health of the tourism sector, its trends and development,” said Liivamägi. Mariann Lugus, Secretary-General of Estonian Association of Travel Agents, said that the up-to-date data and attractive presentation draws attention and sparks interest for analysis. “This helps improve the visibility of the tourism sector and mark its importance. In the course of our work together on the dashboards, we have seen how visualisation makes the otherwise tightly packed data tables more attractive,” said Lugus.
Statistics Estonia’s dashboards are available on the website juhtimislauad.stat.ee in Estonian and English.
The dashboards will be developed further and everyone interested in specific fields or indicators are welcome to contact us.