In the 2nd quarter the economy was continuously in decline
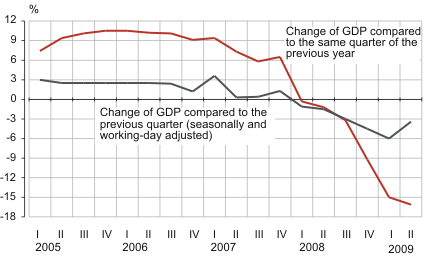
In the 2nd quarter compared to the 1st quarter of the previous year, the seasonally and working-day adjusted GDP decreased by 3.4%. The decrease of the GDP compared to the previous quarter decelerated. In the 1st quarter this year the GDP decreased by 6% and in the 4th quarter of the previous year by 4.5% compared to the previous quarter.
In the 2nd quarter, the GDP at current prices was 53.9 billion kroons.
GDP real growth, 1st quarter 2005 – 2nd quarter 2009
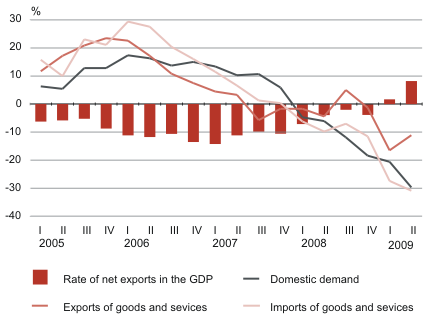
Compared to the 2nd quarter of the previous year, the decrease in the GDP was continuously influenced by steeply decreased domestic and external demand. The domestic demand decreased by 30% above all due to the substantial decrease in household final consumption expenditures, gross fixed capital formation and inventories. The share of the domestic demand in the GDP decreased to 92%, which was the smallest indicator since 1995.
Household final consumption expenditures decreased by 21%. Expenditures decreased in all expenditure divisions, but the decrease in expenditures on recreation and culture, transport and miscellaneous goods and services (e.g. financial services, personal care, etc.) had the biggest effect on household final consumption expenditures. The gross fixed capital formation decreased by 39%, whereas the decrease in investments in non-financial corporations’ and households’ sectors had the biggest influence on it. By fixed assets, investments decreased the most in transport equipment and other machinery and equipment. Corporations’ inventories decreased steeply in the 2nd quarter.
Due to the weak domestic demand imports of goods and services decreased significantly (by 31% in real terms). Imports of goods decreased by 32% and imports of services by 26%. The decrease in imports of machinery and mechanical equipment, motor vehicles, chemicals and chemical products and metal production had the biggest impact on the imports of goods. At the same time, imports of refined petroleum products increased. Exports of goods and services decreased fast due to the weak external demand. However, the decrease in exports decelerated somewhat in real terms (in the 1st quarter exports decreased by 17%, in the 2nd quarter by 11% compared to the same quarter of the previous year). Exports of goods decreased by 13% and exports of services by 7%. The decrease in exports of electrical machinery and apparatus, wood and wood products and metal production had the biggest influence on the exports of goods. At the same time, exports of refined petroleum products increased substantially. The decrease in exports of freight transport services of road transport, travel, construction and other business services influenced the exports of services the most. At the same time, exports of railway transport services and communications services increased. The share of net exports in the GDP was 8.2% being the highest rate since 1995. This indicator has continuously improved during the last two years.
Real growth of the domestic demand, exports and imports of goods and services,
1st quarter 2005 – 2nd quarter 2009
The value added decreased in all economic activities, except public administration and defence. A steep decrease of the value added in manufacturing, construction and retail and wholesale trade influenced the decrease of GDP the most. In manufacturing the value added decreased by 31%. The value added decreased the most in the production of transport equipment, chemicals and chemical products and building materials. The value added in manufacturing decreased due to the weak domestic demand and by virtue of that, the decrease in orders. A steep decrease of the value added of construction (31%) was caused by the decrease in construction volume of dwellings in the domestic market and the decrease in construction of infrastructure. The decrease in the value added of wholesale influenced the decrease in the value added of wholesale and retail trade activity (21%).
Statistics Estonia revised the national accounts data for 2005–2008 based on the supply and use tables and annual reports of enterprises. In addition, calculations of exports and imports for 2004 were revised based on the balance of payments, estimates of actual and imputed rents were updated since 1995 and some units were reclassified between non-financial corporations and general government sector since 2002. The GDP for the 1st quarter of 2009 was also revised.
As a result of the revisions, the annual GDP at current prices increased by 0.2–2.3% in 1995–2008 and quarterly GDP real growth changed in the same period between -0.7 to +2.1 percentage points.
See a more detailed overview about the revisions made in 2009: Statistics > Subject areas > Economy > National accounts > The Gross Domestic Product (GDP) Revisions in 2009 /uudised/dokumendid/37447
See additional information about the frequency and principles of the GDP revisions: Statistics > Subject areas > Economy > National accounts > Overview of the Gross Domestic Product (GDP) Revision Principles /uudised/dokumendid/37446