GDP growth in the 2nd quarter was supported by the exports of industrial sector
The seasonally and working-day adjusted GDP increased by 1.9% in the 2nd quarter compared to the 1st quarter. The seasonally and working-day adjusted GDP increased successively for three quarters. In the 1st quarter this year the GDP increased by 1.1% compared to the previous quarter.
In the 2nd quarter, the GDP at current prices was 56.1 billion kroons (3.59 billion euros).
The GDP was influenced both by the weak domestic demand and by the improved external demand and the growth of exports resulting from that. Although the domestic demand grew by 2%, it was still weak having the share of only 90% of the GDP (i.e., the total of the domestic final consumption expenditures, gross fixed capital formation and change of inventories were smaller than the created value added). Whereas the final consumption expenditures and investments continued decreasing, the rise of the domestic demand was mostly influenced by the increase in inventories. Households final consumption expenditures decreased by 3% influenced on the one hand by the decrease in expenditures on the goods and services of recreation and culture and food and non-alcoholic beverages, on the other hand by the increase in expenditures on financial services.
Gross fixed capital formation decreased by 17% influenced mostly by the decrease in investments by the general government sector. By fixed assets, investments of the total economy in buildings and structures decreased the most influenced mainly by the sharp decrease in investments of the general government in the referred fixed assets. Gross fixed capital formation has decreased since the 3rd quarter of 2007. While the share of the gross fixed capital formation in the GDP was 35% in 2007, it has decreased to merely 16% by the 2nd quarter this year.
Increase in inventories of work in progress and of materials and supplies of non-financial corporations contributed to the growth of the domestic demand.
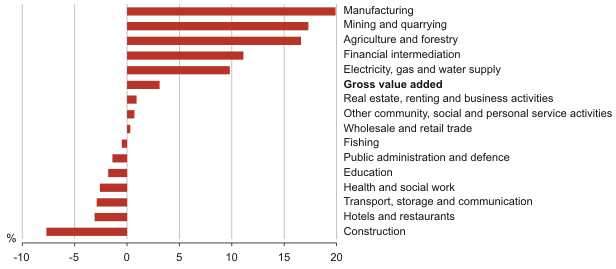
On the supply side, the GDP growth was influenced mostly by the growth of the value added of manufacturing (20%) supported by the strong export growth. The sales of manufacturing production on the domestic market still decreased. The growth of the value added of the electricity production was supported by exports, as well, which in turn, contributed to the growth of the value added of the mining of oil shale. At the same time, the impact of the previously referred economic activities on the GDP growth was modest. The GDP growth was supported by the growth of the value added in agriculture and forestry and financial intermediation. The growth of value added of financial intermediation was above all influenced by the growth of the income gained by banks from service fees and by the growth of net premiums of insurance companies.
The GDP growth was restrained by the decrease of the value added in construction and transport, storage and communications (by 8% and 3%, respectively). The decrease of the value added in construction was influenced by the weak domestic demand. At the same time the decrease of this economic activity decelerated in the 2nd quarter (the value added of construction decreased by 29% in the 1st quarter this year). The decrease of the value added of transport, storage and communications was caused by the decrease of the value added in land transport and postal services and communications.
Export of goods and services grew in real terms 18% in the 2nd quarter in support of the improvement of the external demand. Export of goods increased by 29%. The growth was influenced mainly by the growth of exports of wood and wood products, metals and radio, television and communication equipment. Export of services in real terms remained approximately on the same level compared to the same quarter of the previous year. Import of goods and services increased by 23%, including import of goods by 25% and import of services by 17%. The growth of import of goods was influenced mainly by the growth of imports of radio, television and communication equipment and mining products. Export of goods and services has exceeded imports since the 1st quarter of the previous year. The share of net export in the GDP was 6% in the 2nd quarter of the current year.
Change of the value added of the economic activities by chain-linked method compared to the same quarter of the previous year in the 2nd quarter of 2010, percentage
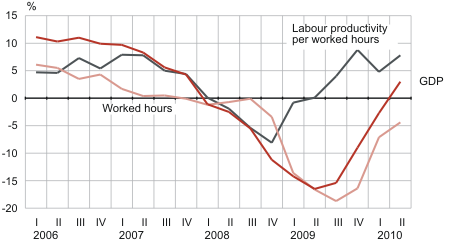
In the 2nd quarter the GDP increased in spite of the decrease in hours worked. This resulted in the growth of labour productivity per hours worked by 7.8% compared to the same quarter of the previous year and by 2.5% compared to the previous quarter. Labour productivity per hours worked has increased already since the 2nd quarter of the previous year. The productivity has been calculated by the resident production units (domestic concept) and by seasonally and working-day adjusted figures.
The change of the seasonally and working-day adjusted GDP, labour productivity per hours worked and hours worked compared to the same quarter of the previous year, 1st quarter 2006 – 2nd quarter 2010, percentage
Statistics Estonia revised the national accounts data for 2006–2009 based on the supply and use tables and annual reports of enterprises. The GDP for the 1st quarter of 2010 was also revised. As a result of the revisions, the annual GDP at current prices increased by 0.2–1.3%. The annual GDP growth by chain-linked method during the referred period changed -1.5 to 0.6 percentage points and quarterly GDP real growth changed in the same period between -1.8 to 1.1 percentage points.