Electronics industry pulled the growth of industrial production in November
The significant growth in manufacturing that took place in September was replaced with a small decline in October, but turned to the growth in November again. In November the increase in manufacturing was 8% compared to the same month of 2011. The main reason for the growth in production was the low reference base of 2011 in the manufacture of electronic products. In September 2011, the growth in the manufacturing of electronic products slowed down sharply, which affected the whole industrial production output. Since September 2012, the production volume in this branch has recovered, covering about a fourth of the total manufacturing output. Among the branches of industry holding larger shares, in November compared to the same month of 2011, the production rose only in the manufacture of wood products. In most of the branches of industry the volume of production fell, including in the manufacture of food and metal products and electrical equipment.
In November 2012, 72% of the whole production of manufacturing was sold on the external market. Since September, export has increased substantially compared to the same month of 2011 – export sales of manufacturing production grew 13% in September, 14% in October and 18% in November. The increase in exports was mainly caused by the rapid growth in sales of electronic products as well.
In November 2012 compared to October, the seasonally adjusted total industrial production increased by 5%, the production in manufacturing increased by 6%.
Compared to November 2011, the production of electricity decreased by 8% and the production of heat increased by 11%.
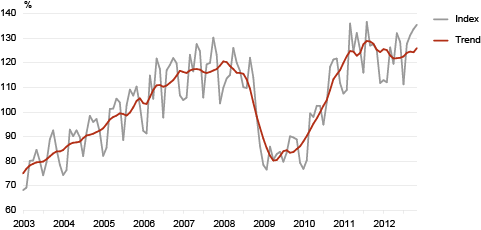
The volume index and trend of production in manufacturing, January 2003 – November 2012 (2005 = 100)
| Economic activity | Change compared to the previous month according to seasonally adjusted dataa | Change compared to the corresponding month of the previous year | |
|---|---|---|---|
| according to unadjusted data | according to working-day adjusted datab | ||
| TOTAL | 4.7 | 6.5 | 6.5 |
| Energy production | -1.6 | -2.4 | -2.4 |
| Mining | -2.5 | -6.2 | -6.2 |
| Manufacturing | 6.1 | 8.3 | 8.3 |
| manufacture of computer, electronic and optical products | 22.8 | 93.3 | 93.3 |
| manufacture of wood and wood products | -0.5 | 1.4 | 1.4 |
| manufacture of food products | -1.6 | -1.3 | -1.3 |
| manufacture of fabricated metal products | 3.3 | -6.7 | -6.7 |
| manufacture of electrical equipment | -16.6 | -19.5 | -19.5 |
| manufacture of chemicals and chemical products | 15.7 | -6.5 | -6.5 |
| manufacture of furniture | 2.8 | 0.2 | 0.2 |
| manufacture of motor vehicles | -12.4 | -0.4 | -0.4 |
| manufacture of building materials | 6.2 | -2.7 | -2.7 |
| manufacture of rubber and plastic products | 2.2 | -5.6 | -5.6 |
a In case of the seasonally adjusted volume index of industrial production, the impact of the differing number of working days in a month and seasonally recurring factors have been eliminated. It is calculated only in comparison with the previous period.
b In case of the working-day adjusted volume index of industrial production, the impact of the differing number of working days in a month has been eliminated. It is calculated only in comparison with the corresponding period of the previous year.