The economic structure in the counties is changing
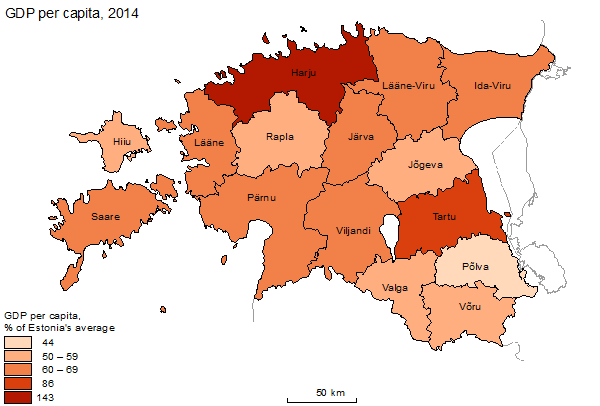
The share of Harju county in the Estonian gross domestic product (GDP) in 2014 was 12.4 billion euros at current prices, 9 billion euros of which came from Tallinn. Harju County was followed by Tartu and Ida-Viru counties, which respectively accounted for 10% and 8% of the Estonian GDP. Hiiu and Põlva counties had the smallest share, each having contributed less than 1% of the Estonian GDP.
In 2014, more than 68% of the gross value added in Estonia was created in the service sector. The continuously growing sector was the largest sector in all the counties except for Ida-Viru county. The influence of the cities of Tallinn and Tartu resulted in Harju and Tartu counties having the largest share of services – 77% and 70%, respectively. The three counties creating the greatest value added (Harju, Tartu and Ida-Viru counties) accounted for 85% of the value added of the entire service sector. In recent years, the growth of the sector has been the most prominent in counties where services already make up more than 50% of the value added of the county. Since 2011, the fastest growth in the service sector has taken place in Lääne and Saare counties.
| County | Share of service sector in regional value added | Change in share of service sector | |||
|---|---|---|---|---|---|
| 2011 | 2012 | 2013 | 2014 | 2011–2014 | |
| Harju | 75.2 | 75.1 | 76.3 | 77.1 | 1.9 |
| Tallinn | 78.8 | 78.5 | 80.0 | 81.0 | 2.2 |
| Hiiu | 49.8 | 50.2 | 51.1 | 51.1 | 1.3 |
| Ida-Viru | 42.2 | 45.1 | 38.3 | 39.7 | -2.5 |
| Jõgeva | 48.5 | 47.2 | 46.1 | 46.6 | -1.9 |
| Järva | 47.3 | 45.7 | 47.7 | 48.1 | 0.9 |
| Lääne | 56.1 | 57.0 | 59.5 | 59.9 | 3.8 |
| Lääne-Viru | 47.5 | 47.9 | 46.4 | 46.7 | -0.8 |
| Põlva | 49.9 | 51.0 | 55.1 | 55.8 | 5.9 |
| Pärnu | 56.2 | 55.9 | 55.1 | 56.0 | -0.2 |
| Rapla | 56.9 | 55.5 | 56.4 | 56.8 | -0.1 |
| Saare | 50.4 | 51.3 | 53.4 | 54.6 | 4.1 |
| Tartu | 69.6 | 68.5 | 69.2 | 70.1 | 0.4 |
| Tartu city | 74.8 | 74.8 | 76.3 | 77.2 | 2.3 |
| Valga | 50.6 | 51.5 | 49.0 | 49.3 | -1.3 |
| Viljandi | 50.3 | 49.0 | 49.7 | 50.1 | -0.2 |
| Võru | 52.4 | 53.3 | 49.5 | 49.5 | -2.9 |
| Whole country | 66.9 | 67.2 | 67.6 | 68.4 | 1.5 |
Industry and construction accounted for 28% of the gross value added of Estonia in 2014. The three counties creating the greatest value added accounted for three-quarters of the value added of the sector in the entire country. While in the rest of Estonia the share of the sector is either stable or decreasing, Ida-Viru county is the only county showing growth in the share. Since 2010, the share of industry and construction in Ida-Viru county has increased more than 5% and accounted for 59% of the value added of the county by 2014. In all other counties, the share of the sector is less than 42% of the value added of the county.
Agriculture, forestry and fishing accounted for 3% of the gross value added of Estonia in 2014. This sector had the largest share in Jõgeva county (22%). The counties not showing a downward trend in the share of the sector are Valga, Võru, Viljandi, Lääne-Viru, Hiiu and Saare counties.
In 2014, the GDP per capita was 15,186 euros, which was 759 euros more than a year earlier. The GDP per capita was the highest in Harju county, exceeding the Estonian average by 43%. Harju County was followed by Tartu and Ida-Viru counties, where the GDP per capita was respectively 14% and 31% below the Estonian average. The GDP per capita was the lowest in Põlva county.
Industry and construction – mining and quarrying; manufacturing; electricity, gas, steam and air conditioning supply; water supply; sewerage, waste management and remediation activities; construction.
Services – wholesale and retail trade; repair of motor vehicles and motorcycles; transportation and storage; accommodation and food service activities; information and communication; financial and insurance activities; real estate activities; professional, scientific and technical activities; administrative and support service activities; public administration and defence; compulsory social security; education; human health and social work activities; arts, entertainment and recreation; other service activities.