Innovativeness of enterprises continually at good level
An enterprise was considered technologically innovative if during the last three years it had introduced to market a new or significantly improved product, implemented a new or significantly improved process, or had expenditure on activities specifically undertaken to develop and/or implement a product or process innovation.
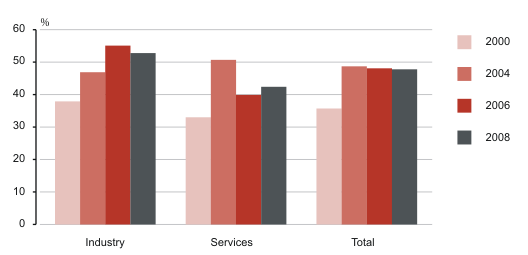
It can be noticed that the general picture remained quite stable during 2004–2008, only for services the period when active innovative activities took place in connection with Estonia’s entering the European Union is distinct. Drawing comparisons it should be emphasised that the European Union mean values for technological innovativeness equalled 41% for industry and 36% for services in 2006 inferring that Estonia belongs continually to the group of successful Member States.
The share of technologically innovative enterprises, 2000–2008
As earlier the survey demonstrated that innovativeness in Estonia similarly with the European Union is higher for enterprises belonging to concerns (even in the case of national concern — 60% in 2008), having foreign equity or employing higher number of people.
| Activity | The share of innovative enterprises, % |
|---|---|
| Manufacture of basic pharmaceutical products and pharmaceutical preparations | 100 |
| Insurance, reinsurance and pension funding, except compulsory social security | 94 |
| Telecommunications | 87 |
| Manufacture of chemicals and chemical products | 84 |
| Manufacture of beverages | 76 |
| Financial service activities, except insurance and pension funding | 75 |
| Manufacture of other non-metallic mineral products | 75 |
| Manufacture of computer, electronic and optical products | 74 |
The manufacture of leather and wearing apparel, as well as the land transport ended the ranking list of activities with innovativeness below one third. To vindicate the leather and wearing apparel manufacturing it should be noted that changes in design are classified as marketing not product innovations.
The additional module of the current survey dealt with innovations with environmental benefits. 28% of enterprises declared that they have regular procedures in place to identify and reduce environmental impacts. One third of those introduced or significantly improved procedures under consideration during 2006–2008. The existence of voluntary codes for environmental good practice within enterprise's activity and need to comply with existing environmental regulations were considered as main reasons for implementing innovations with environmental benefits.
Non-technological innovations — organisational and marketing ones — were first time handled in core questionnaire. In the case of previous survey the supplementary module with different questions served the purpose. For that reason the data on non-technological innovations from the current survey are not comparable with previous ones. However, again the close ties between different kinds of innovation were verified: 56% of technologically innovative enterprises had implemented organisational or marketing innovation and only 16% of technologically non-innovative ones.
The Community Innovation Survey is regularly carried out by statistical organisations of all European Union Member States on the basis of the harmonised methodology. The innovation survey does not cover the sectors as a whole and is dealing with enterprises with at least 10 persons employed. In the case of industry only the construction activity was excluded in 2008, as for services the following activities were included: wholesale trade, transportation and storage, information and communications (except film and TV production and broadcasting), financial and insurance activities, architectural and engineering activities, technical testing and analysis. In 2008 the frame of the survey consisted of 2,102 industrial and 1,921 service enterprises.
Innovation survey serves as a kind of litmus paper which shows an enterprise’s attitude to reporting statistical data. It is emphasized in the guidelines of the survey that questions of the survey should be answered by someone responsible for development on the management level and not by a financial manager. But in fact, the task concerned was often assigned to an accounting clerk who, without a second thought, states that there is no innovativeness in the enterprise disregarding the fact that the enterprise’s website or annual reports reveal something totally different. Thus, hundreds of enterprise managers had to be spoken in order to ensure the quality of statistics and obtain true answers to the questions on innovativeness. Certain complexity was added to the realization of the survey by the fact that the posted questionnaires were replaced by filled online ones on the Internet site.