The share of the service sector in counties has grown
The gross domestic product (GDP) of Estonia reached 20 billion euros at current prices in 2015. Harju County’s contribution amounted to 63%, 9 billion euros of which came from Tallinn. Harju County was followed by Tartu County and Ida-Viru County, the shares of which in Estonia’s GDP stood at 10% and 7%, respectively. Hiiu and Põlva counties had the smallest share, each having contributed less than 1% to the Estonian GDP.
The influence of the cities of Tallinn and Tartu resulted in Harju County and Tartu County having the largest share of services – 77% and 70%, respectively. In total, the three counties having made the greatest contribution to GDP accounted for 86% of the value added of the entire service sector. In recent years, the growth in the share of the sector has been the fastest in Lääne, Järva and Ida-Viru counties. Nevertheless, it cannot be said that the rest of Estonia is catching up with Harju and Tartu counties, as the majority of the development in the service sector is still taking place in the cities of Tallinn and Tartu.
| County | Share of service sector in regional value added | Change in share of service sector, 2012–2015 | |||
|---|---|---|---|---|---|
| 2012 | 2013 | 2014 | 2015 | ||
| Harju | 75.4 | 76.4 | 76.1 | 77.3 | 2.0 |
| ..Tallinn | 78.8 | 80.3 | 80.1 | 81.5 | 2.7 |
| Hiiu | 50.8 | 51.4 | 52.8 | 53.6 | 2.8 |
| Ida-Viru | 45.0 | 38.3 | 40.7 | 43.5 | -1.5 |
| Jõgeva | 47.9 | 46.0 | 45.3 | 46.5 | -1.4 |
| Järva | 46.0 | 47.6 | 48.8 | 49.5 | 3.5 |
| Lääne | 57.2 | 59.7 | 61.6 | 61.1 | 3.9 |
| Lääne-Viru | 48.4 | 46.4 | 43.5 | 44.2 | -4.2 |
| Põlva | 51.4 | 55.0 | 55.1 | 55.7 | 4.3 |
| Pärnu | 56.6 | 55.1 | 55.7 | 56.4 | -0.1 |
| Rapla | 56.2 | 56.4 | 53.8 | 54.7 | -1.4 |
| Saare | 52.4 | 53.9 | 53.9 | 54.9 | 2.5 |
| Tartu | 69.3 | 69.4 | 69.0 | 70.2 | 0.9 |
| ..Tartu city | 75.4 | 76.4 | 75.8 | 77.0 | 1.6 |
| Valga | 52.1 | 48.8 | 48.6 | 49.2 | -2.9 |
| Viljandi | 49.5 | 49.5 | 45.9 | 47.1 | -2.3 |
| Võru | 53.9 | 48.8 | 47.7 | 49.3 | -4.7 |
| Estonia total | 67.6 | 67.7 | 67.8 | 69.2 | 1.6 |
Industry and construction accounted for 27% of the gross value added of Estonia in 2015. The three counties creating the greatest value added accounted for three-quarters of the value added of the total economy in this sector. Throughout the years, the sector has had the largest share in Ida-Viru County, but in the last two years the share of the sector in the county has decreased considerably – from 61% to 56%. The largest increase in the share of the sector has taken place in Lääne-Viru County, with the sector accounting for as much as 44% of the value added of the county in 2015. This made Lääne-Viru County the second county where the share of industry and construction is not lagging behind that of the service sector.
The agricultural sector accounted for 3% of the gross value added of Estonia in 2015. This sector had the largest share in Jõgeva County, generating 24% of the value added of the county. While the share of the sector in value added is in decline in most counties, it is not the case in Viljandi, Jõgeva, Võru and Rapla counties, where the share of the agricultural sector in the generation of value added is increasing instead.
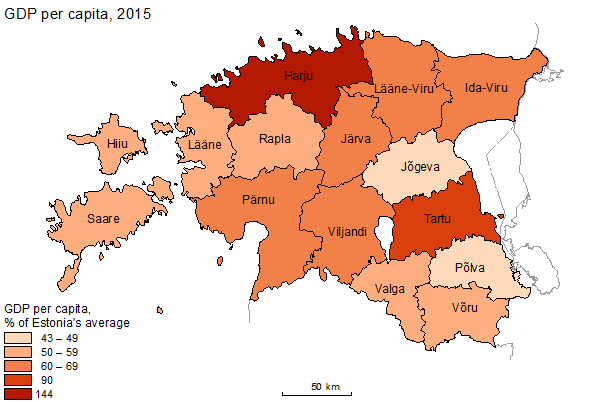
In 2015, GDP per capita was 15,405 euros, which was 375 euros more than a year earlier. GDP per capita was the highest in Harju County – 144% of the Estonian average. Harju County was followed by Tartu and Ida-Viru counties, where GDP per capita amounted to, respectively, 90% and 63% of the Estonian average. The lowest level of GDP per capita in 2015 was recorded in Põlva County. Similarly to the developments in the service sector, Tallinn and Tartu are getting further away from the rest of Estonia in this case as well.
Agricultural sector – agriculture, forestry and fishing.
Industry and construction – mining and quarrying; manufacturing; electricity, gas, steam and air conditioning supply; water supply; sewerage, waste management and remediation activities; construction.
Service sector – wholesale and retail trade; repair of motor vehicles and motorcycles; transportation and storage; accommodation and food service activities; information and communication; financial and insurance activities; real estate activities; professional, scientific and technical activities; administrative and support service activities; public administration and defence; compulsory social security; education; human health and social work activities; arts, entertainment and recreation; other service activities.
For the statistical activity “Regional GDP”, the main representative of public interest is the Ministry of Finance, on whose commission Statistics Estonia performs this statistical activity.